By Richard Clark, InduSoft
The University of Texas at Austin campus is large — something on the order of a small city. The campus has every type of physical environment imaginable. From Opera Halls to Football Stadiums. From Foreign Language Classrooms to Research Laboratories. From Restaurants to Hospitals and Medical Training Facilities. Now imagine having to provide for all that, steam for electricity and heating, chilled water for cooling, emergency power, deionized water and pressurized air for an area of buildings, offices and classrooms covering an area of 17 million square feet.
The Utilities and Energy Management Department at UT Austin is managed by the following individuals, who provided the information for this case study. Anthony Estrada designed the InduSoft application monitoring the physical plant statistics:
Juan Ontiveros, P.E.
Executive Director
Roberto Del Real, P.E.
Control Systems Manager
Anthony Estrada
Utilities Systems Programmer
Aaron Mitchell
Controls Implementation
PLANT LOCATION
University of Texas at Austin
215 E. 24th Street
Austin, TX 78712 US
The Background and Statistics of the Physical Plant
The Utilities and Energy Management Department is a part of the department of Employee and Campus Services at the University of Texas at Austin. They use innovation and technology to provide reliable and cost-effective electricity, chilled water, steam, deionized water, compressed air, emergency power, and elevators that support the tradition of teaching and research excellence at the university. The department self-produces 100% of the energy needs for the 17 million square foot campus.
UT Austin has 6 miles of underground service tunnels and electrical duct banks servicing 170 buildings. With about 250,000 gross square feet added each year, and about 2 million new square feet is currently in design and construction, the scale of the infrastructure is that of a small city. The physical plant itself has 135 MW of electrical generation capacity generated at 12KV and 4160 volts. The physical plant has 44,000 tons of cooling capacity along with a 36,000 Ton-hr thermal energy storage facility producing 39° F chilled water for the campus cooling needs. The steam plant generates 425 psi, 700° F steam for the turbines and the resultant drop (waste heat) of 150 psi, 500° F steam unused by the turbines is sent to the rest of the campus for heating and hot water. The capacity of the steam plant is 1.2 million lbs-hr.
Annually the physical plant provides the following:
- 242 million KWh of electricity
- 142 million ton-hrs of chilled water
- 717 million lbs of steam
- 8 million gallons of demineralized water
PROCESS DESCRIPTION
Fuel is typically used most efficiently when generating both power, and thermal heat through Combined Heat and Power. CHP, also known as cogeneration, is the simultaneous production of electricity, and heat from a single fuel source, such as biomass/biogas, natural gas, coal, or oil. CHP can provide:
- Distributed generation of electrical and/or mechanical power
- Waste-heat recovery for heating, cooling, or process applications
- Seamless system integration for a variety of technologies, thermal applications, and fuel types into existing building infrastructure
CHP is not a single technology, but an integrated energy system that can be modified depending on the needs of the energy end user. The hallmark of all well-designed CHP systems is an increase in the efficiency of fuel use. By using waste heat recovery technology to capture a significant proportion of heat created as a byproduct in electricity generation, CHP systems typically achieve total system efficiencies of 60 to 80 percent for producing electricity and thermal energy.
Natural Gas is introduced to the power plant’s Combustion Turbine Generators (CTG’s) and Industrial Boilers. The exhaust of the CTG hot gases are then directed to produce steam for the Steam Turbine Generators (STG’s). These turbines also use steam coming from the Boilers. Low-pressure-steam is extracted from the steam turbines then sent to Campus for building heating purposes. Electric power generated is used for Campus needs, and for use in the electric chillers that produce the cooling for the 17 million square foot Campus.
As part of delivering the various types of services, they built an infrastructure giving the Department the ability to provide billing services, and the energy users the ability to model/predict and build ad-hoc energy usage reports.
The Project
PROJECT REQUIREMENTS
- Ability to provide real-time and historical building energy behavior
- Ability for the user to run meaningful building and meter energy reports
- Ability to provide meter alarming when meters malfunction
- Ability to log meter “maintenance” history
APPLICATION DESIGN
In an interview with Juan Ontiveros, Executive Director:
“We had a manual process for taking meter readings. The infrastructure was built using PLCs and smart electric meters and networking them around Campus. Data gathering from these devices began in 2006 originally using OPC DA technology and a process historian that the Department already owned. MS Excel was used to run energy reports off the historian. It was a very expensive time-consuming and labor intensive process, taking sometimes weeks to produce a bill for just one of the buildings.”
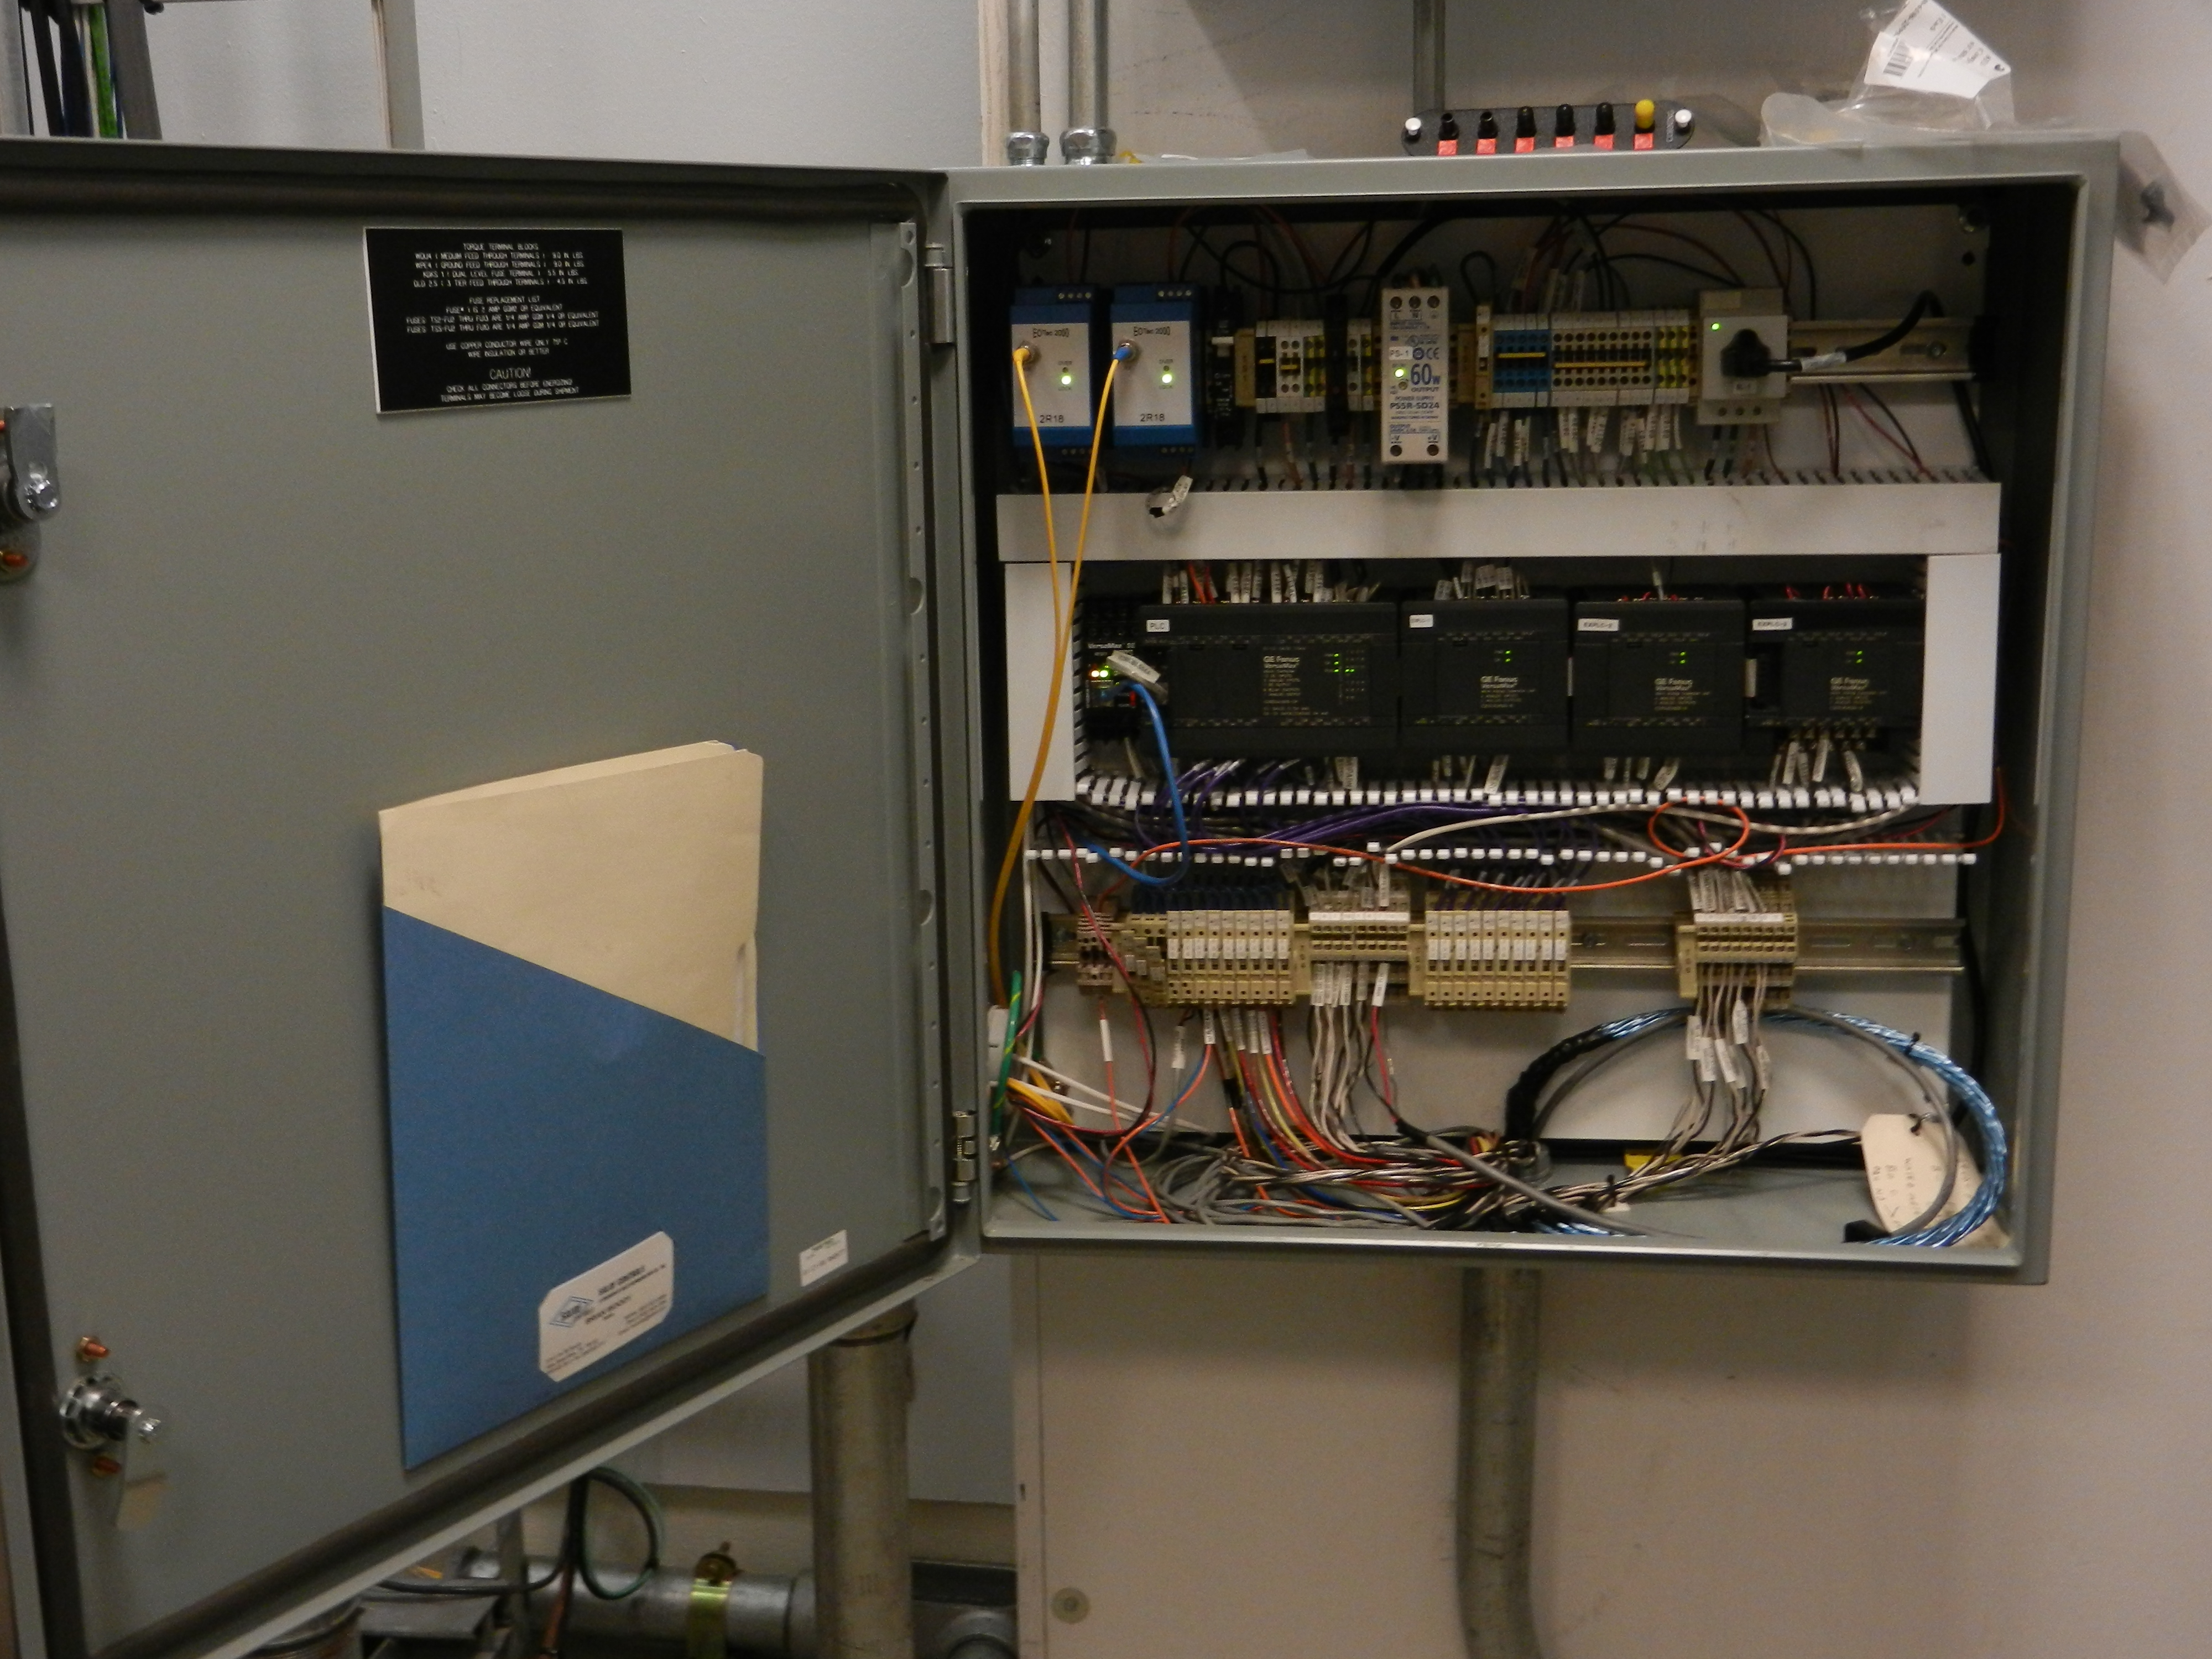
Figure 1: Typical building utilities PLC Cabinet
“The InduSoft installation is one-of-a-kind for the Campus community, and discussions of using it began in 2007, but the original implementation did not take place until early 2010 since we were looking at various programs for competitive purposes.”
The challenges evaluated then were:
- How do we deal with the large amount of metered energy data?
- How can it be displayed in a meaningful way?
- How can it be used to provide us useful information about building behavior?
- How can it be used to track and perform meter and related instrumentation maintenance?
- How can it be used to monitor the ongoing condition of the automated meters?
According to Juan Ontiveros:
“We started the process with just 20 meters that grew to around 200 in 2002 because it became necessary to determine research facility energy use. Up to that point in time all meters were manually read which was not sustainable. We were also adding around 100 to 200 meters a year to the inventory.”
“The decision was made to connect the building meters for electricity, steam, chilled water, and domestic water to a PLC cabinet (Figure 1) which digitized the data that then allowed routing the data to a historian using the campus fiber network. This was a challenging process which including decisions on what do we do with all of the meter data and how do we make sure the meters continue to operate properly? We were previously using “View Run-Time” which is a basic HMI platform made by GE. This was relatively expensive and required client licensing.”
“This is when we learned about the flexibility of InduSoft Web Studio. The power and flexibility available in the application, plus the cost advantage looked very attractive to us. It [InduSoft Web Studio] also looked like it would provide us the ability to build-on and expand as we progressed with automating meters.”
“We looked into [other] various programs that were presented to us, but these were costly and could not be customized to our needs. Being a research institute, it made sense to acquire Indusoft since it presented a unique opportunity to only spend the majority of our funds in the development of the final application, by utilizing the InduSoft Engineering staff to assist us in designing and building it.”
“InduSoft Web Studio is used throughout Campus for metering purposes. We use thin clients through Internet Explorer (Figure 2). A user can see metered energy data of a building anywhere in Campus (Figure 3), and an authorized user can make a VPN connection and access this information anywhere in the world. (Figure 4) When we started utilizing the InduSoft application for data collection and billing, we realized astronomical cost savings over our old manual system, not to mention the fact that the data is immediately available. Our future plans for InduSoft Web Studio include utilizing Studio Mobile Access and the use of Smart Mobile Devices.”
OTHER DEVICES
The final application utilizes a Kepware KEPServerEX OPC UA Server that connects with all the PLCs around campus being monitored. OPC UA was utilized in order to capitalize on the inherent security features of the protocol. Security became extremely important when the InduSoft application was being developed to be web facing for the Thin Clients. Security of the various systems is being constantly monitored and continually upgraded. Existing PCs using energy dashboards around campus are still connected using Kepware LinkMaster OPC DA connectivity.
A Fortinet firewall is used to interface the web-facing side of the application’s Thin Clients and to separate the control system subnet from the rest of the physical plant’s network. Lockheed Martin’s Industrial Defender is also used to monitor the integrity of various firewalls in use within the physical plant.
The group already had the GE iHistorian with Client Tools and it utilizes the Matricon OPC Server for iHistorian for connectivity.
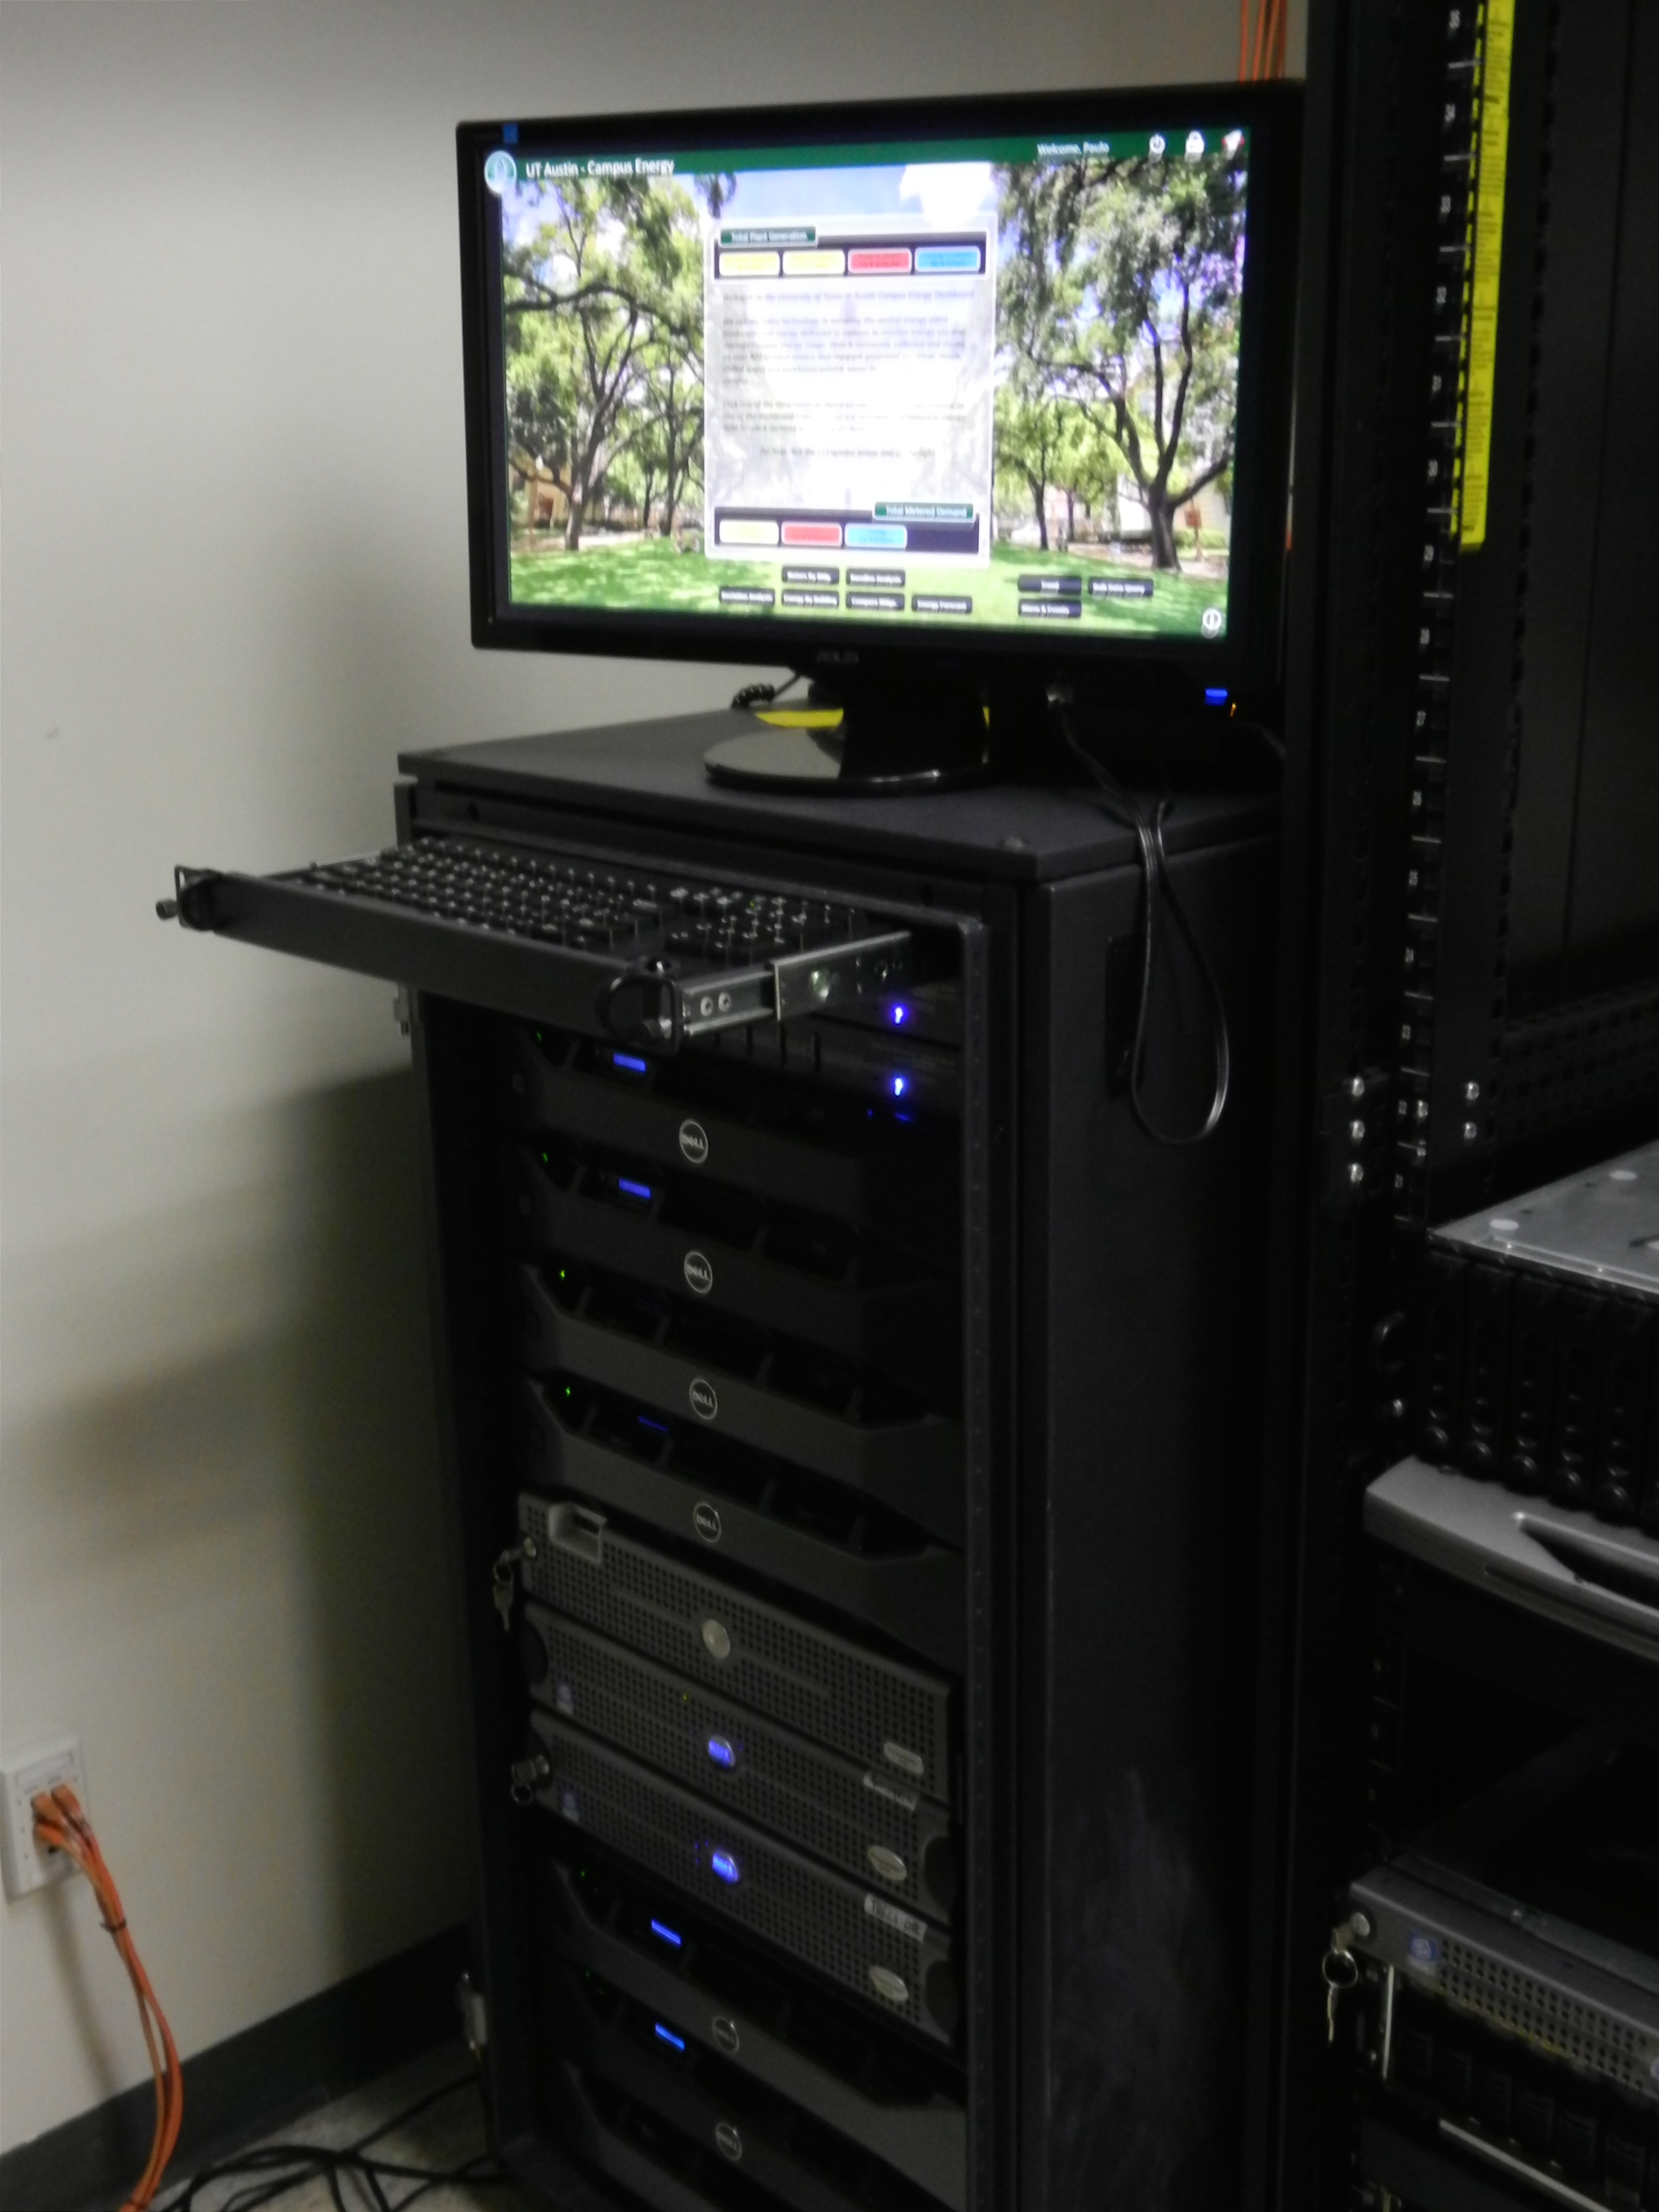
Figure 2: InduSoft Runtime Server and Kepware OPC Server
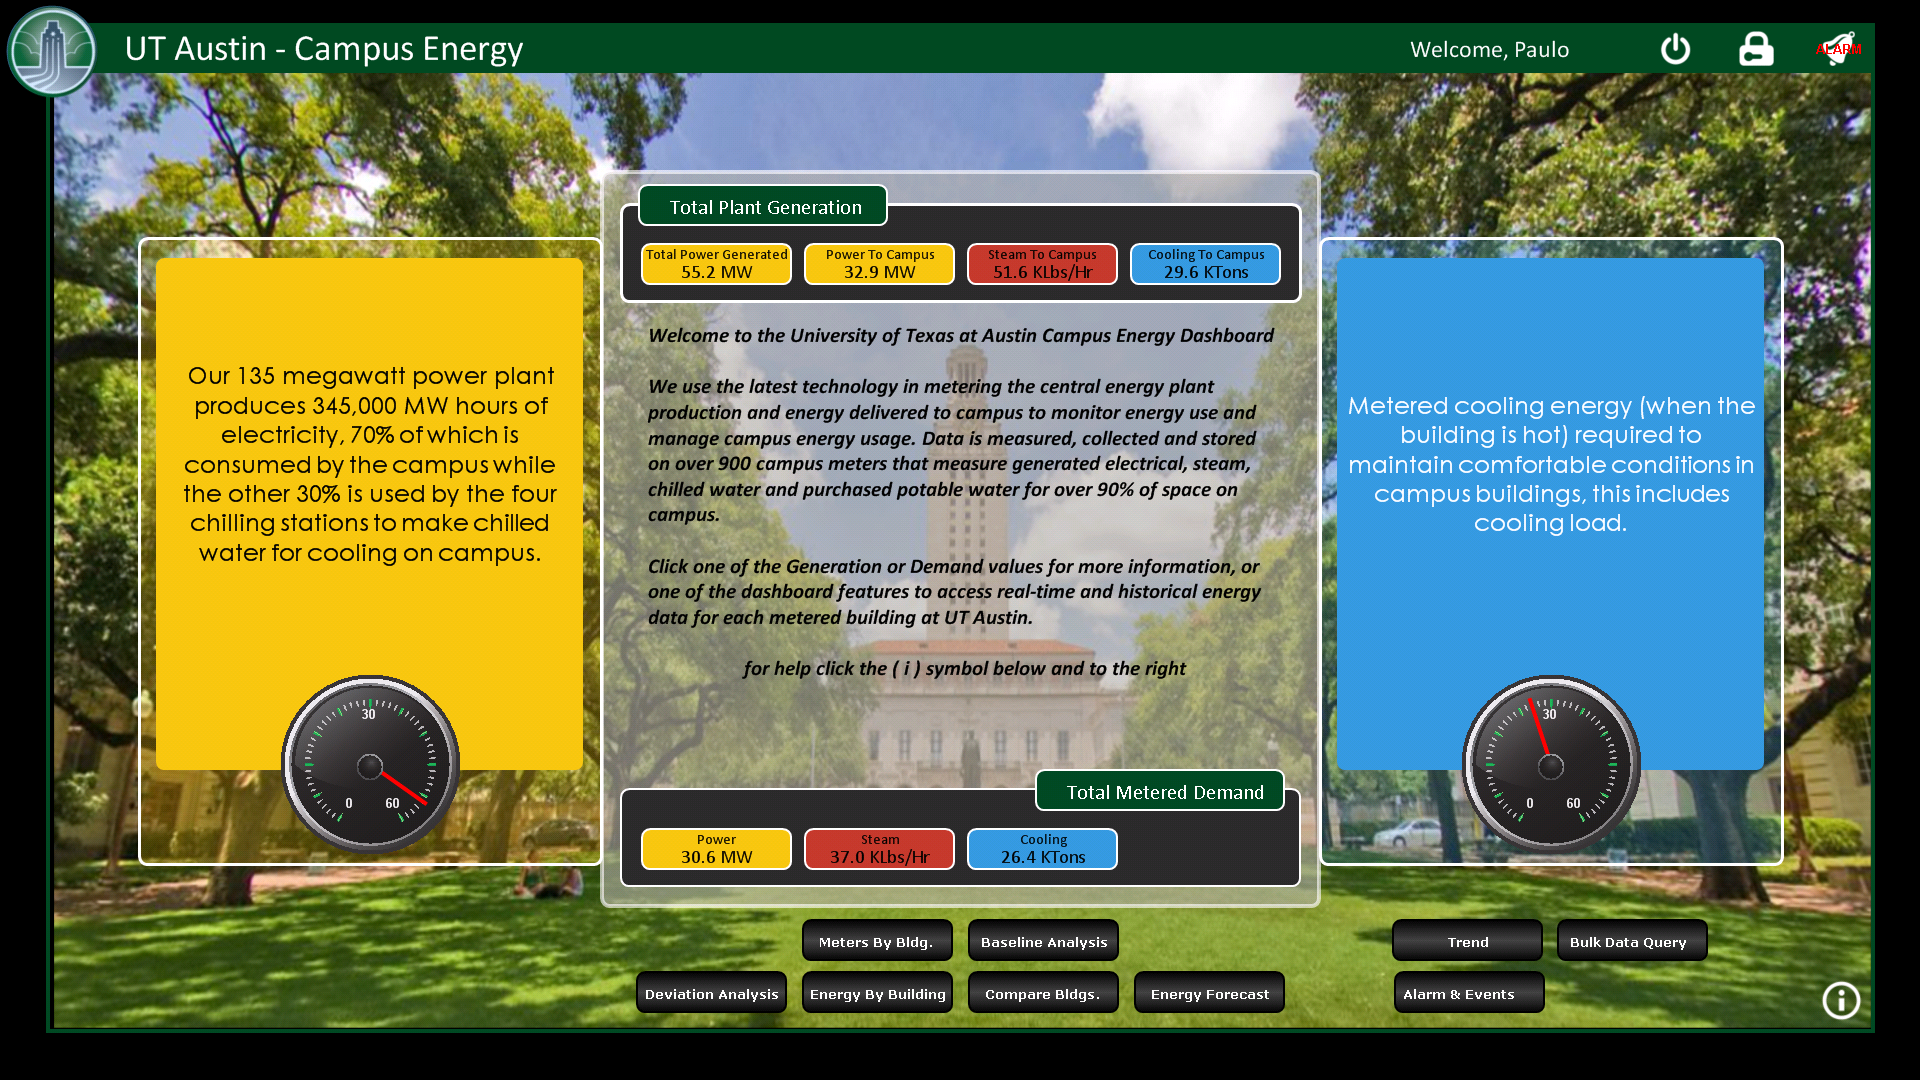
Figure 3: A typical Thin Client
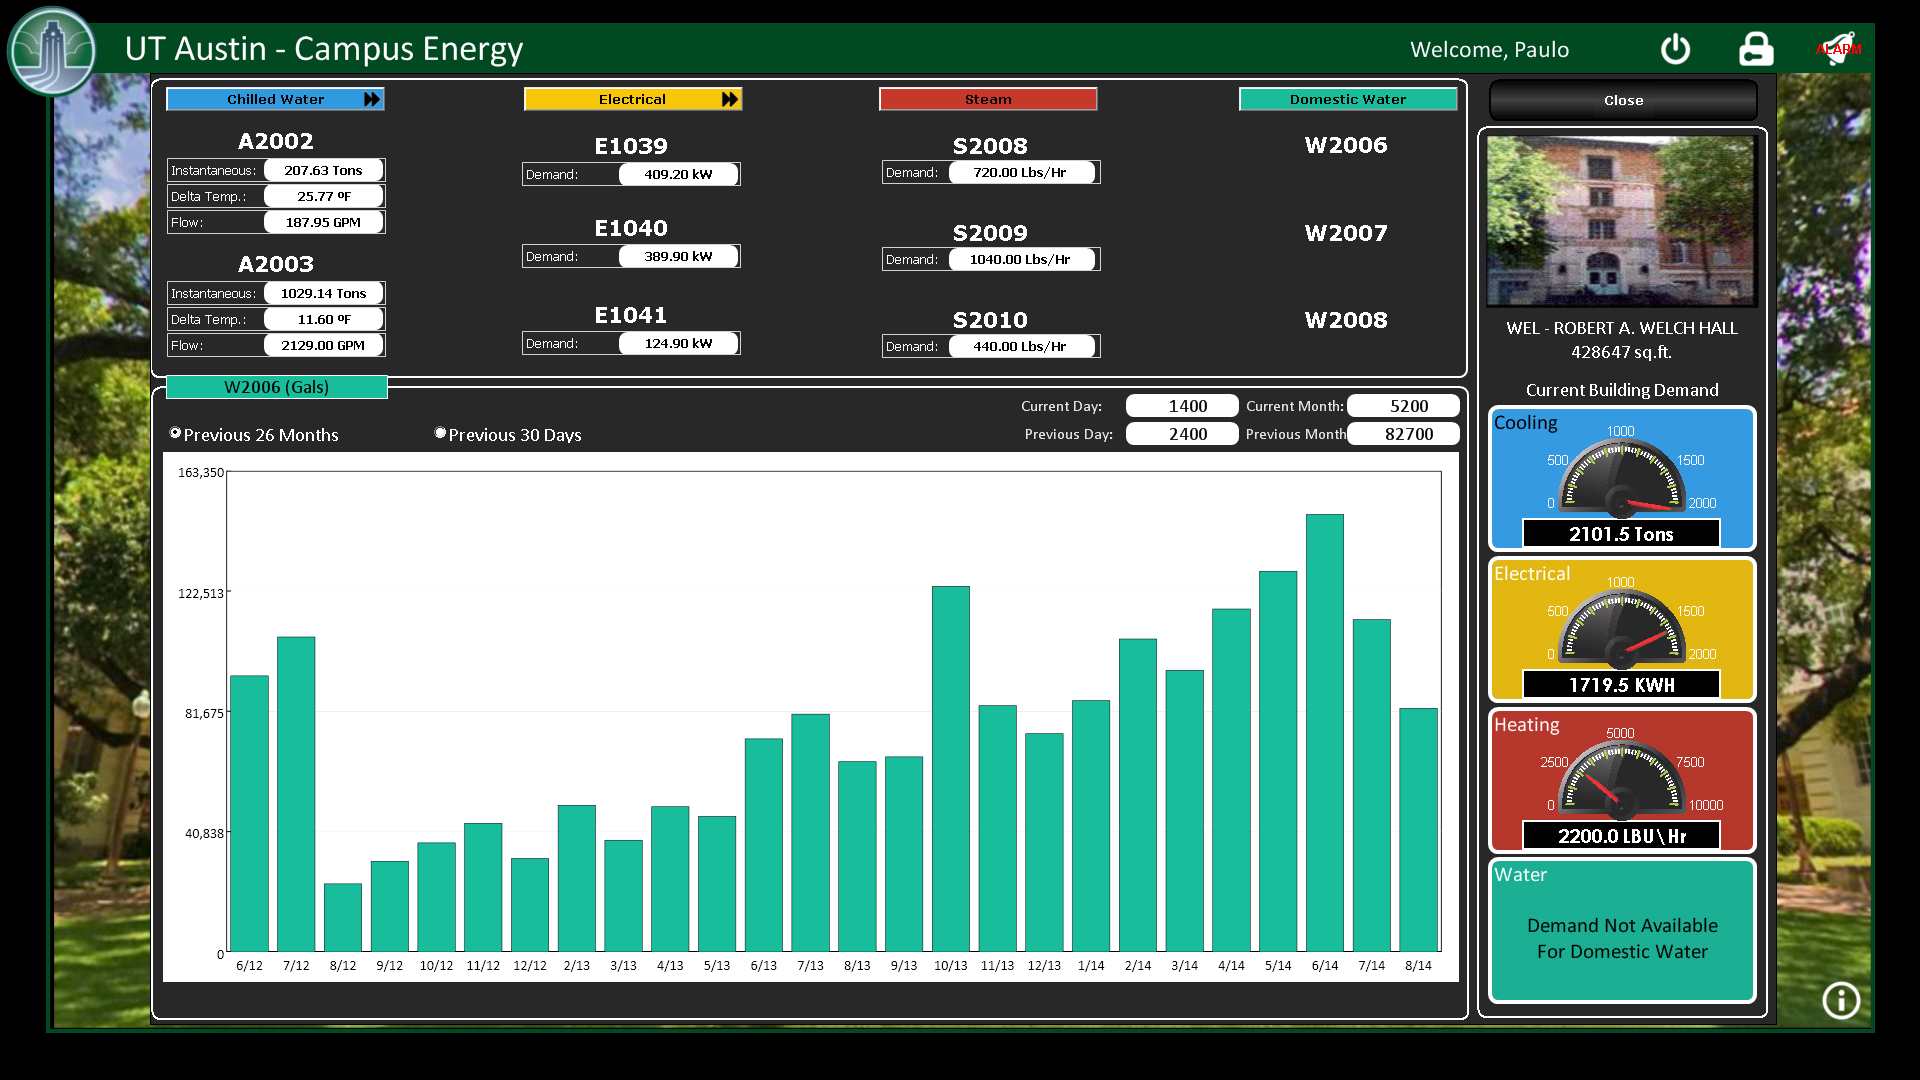
Figure 4: Trend Showing Water Usage
Read more case studies at InduSoft.com